Holling-Tanner model - Demo for Takens-Bogdanov point normal form
Contents
- Differential equations for predator-prey model
- Right-hand side
- Sequence of parameters
- Continuation of steady state branch
- Plot bifurcation diagram
- Continuation of Hopf bifurcation in two parameters
- Detect special points along Hopf curve
- Singularity of defining system for Hopf bifurcation
- Plot Hopf bifurcation in two-parameter plane, including Takens-Bogdanov point
- Test functions for codimension-2 bifurcations along Hopf curve
- Fold bifurcation
- Detect special points along fold curve
- Insert fold in figure 3
- Test functions for codimension-2 bifurcations along fold curve
- Branch off to periodic orbit at some Hopf point, continue to large period
- Convert point close to end of the psol_branch to homoclinic orbit
- Continue branch of homoclinic orbits in two parameters
- Add homoclinic orbit to two-parameter bifurcation diagram
Differential equations for predator-prey model
From: Liu, X., Liu, Y., and Wang, J. (2013). Bogdanov-Takens bifurcation of a delayed ratio-dependent Holling-Tanner predator prey system. In Abstract and Applied Analysis, volume 2013
(c) DDE-BIFTOOL v. 3.1.1(115), 02/09/2015
clear;                           % clear variables
close all;                       % close figures
addpath('../../ddebiftool',...
    '../../ddebiftool_extra_psol',...
    '../../ddebiftool_extra_nmfm',...
    '../../ddebiftool_utilities');
Right-hand side
funcs=set_funcs(...
    'sys_rhs', @HollingTanner_rhs,...
    'sys_tau', @()2,...
   'sys_deri', @HollingTanner_deri,...
   'sys_mfderi',@HollingTanner_mfderi);
Sequence of parameters
indbeta=1;
indtau=2;
inda=3;
indm=4;
indh=5;
inddelta=6;
getpar=@(x,i)arrayfun(@(p)p.parameter(i),x.point);
getx=@(x,i)arrayfun(@(p)p.x(i),x.point);
bgetpar=@(x,i,bif)arrayfun(@(p)p.parameter(i),x.point(br_getflags(x,bif)));
bgetx=@(x,i,bif)arrayfun(@(p)p.x(i),x.point(br_getflags(x,bif)));
Continuation of steady state branch
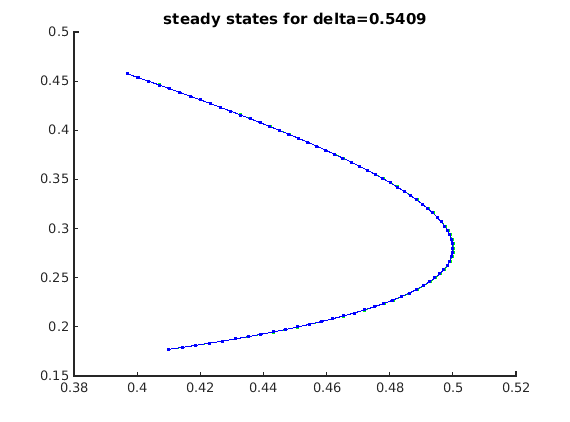
fprintf('----- Steady-state branch -----\n');
beta=0.5;
a=0.5;
m=(1/30)*(1-beta/(a*beta+1));
h=(1/4)*(beta/(a*beta+1)-1)^2+m*beta/(a*beta+1);
tau=1/4*(a*beta+1)^2/beta;
beta=0.4;
delta=0.5409;
stst.parameter=[beta,tau,a,m,h,delta];
parameter_bd={'max_bound',[indbeta,0.6; inddelta,0.7],...
    'min_bound',[indbeta,0.4;inddelta,0.4],...
    'max_step',[0,0.1;indbeta,5e-3;inddelta,5e-3]};
xster=-(1/2)*((beta/(a*beta+1)+2*m-1)+sqrt((1-2*m-beta/(a*beta+1))^2+4*(m*(1-m)-h)));
yster=beta*xster;

contpar=indbeta;
stst_branch0 = SetupStst(funcs,'x',[xster; yster],'parameter',stst.parameter,...
    'contpar',contpar,'max_step',[0,0.005],'min_bound',...
    [contpar 0.4],'max_bound',[contpar 0.6],...
    'newheuristics_tests',0);
figure(1);clf
ax1=gca;
title(ax1,sprintf('steady states for delta=%g',stst.parameter(inddelta)));
[stst_branch0] = br_contn(funcs,stst_branch0,100);
[stst_branch_wbifs,stst_testfuncs]=LocateSpecialPoints(funcs,stst_branch0);
nunst_stst=GetStability(stst_branch_wbifs);
----- Steady-state branch -----
BR_CONTN warning: boundary hit.
StstCodimension1: calculate stability if not yet present
StstCodimension1: (provisional) 1 fold 1 Hopf  detected.
br_insert: detected 1 of 2: fold. Normalform:
    b: -4.8868
br_insert: detected 2 of 2: hopf. Normalform:
    L1: 192.73
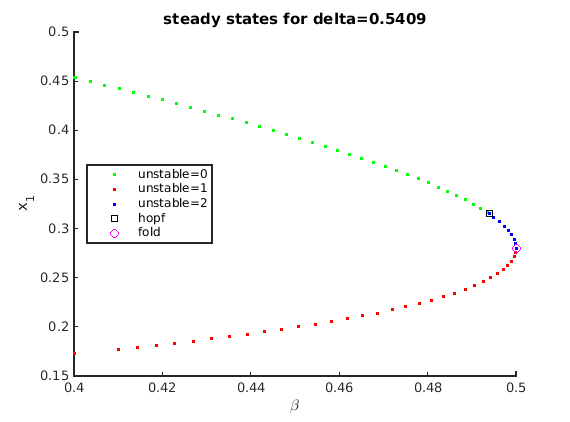
Plot bifurcation diagram
beta_stst=getpar(stst_branch_wbifs,indbeta);
x1_stst=getx(stst_branch_wbifs,1);
cla(ax1);
plot(ax1,beta_stst(nunst_stst==0),x1_stst(nunst_stst==0),'g.',...
    beta_stst(nunst_stst==1),x1_stst(nunst_stst==1),'r.',...
    beta_stst(nunst_stst==2),x1_stst(nunst_stst==2),'b.',...
    bgetpar(stst_branch_wbifs,indbeta,'hopf'),bgetx(stst_branch_wbifs,1,'hopf'),'ks',...
    bgetpar(stst_branch_wbifs,indbeta,'fold'),bgetx(stst_branch_wbifs,1,'fold'),'mo');
stst_lgtext={'unstable=0','unstable=1','unstable=2','hopf','fold'};
legend(ax1,stst_lgtext,'location','west');
xlabel(ax1,'\beta');
ylabel(ax1,'x_1');
title(ax1,sprintf('steady states for delta=%g',stst.parameter(inddelta)));
Continuation of Hopf bifurcation in two parameters
after initialization of hopfbranch
fprintf('----- Hopf branch -----\n');
[hopf_branch0,suc] = SetupHopf(funcs, stst_branch_wbifs, br_getflags(stst_branch_wbifs,'hopf'),...
    'contpar', [inddelta,indbeta],...
    'dir', indbeta, 'step', 0.002,parameter_bd{:});
disp(['suc=',num2str(suc)]);
figure(2);clf
ax2=gca;
title(ax2,'Hopf in beta-delta plane');
hopf_branch0=br_contn(funcs,hopf_branch0,300);
----- Hopf branch -----
suc=1
BR_CONTN warning: boundary hit.

Detect special points along Hopf curve
fprintf('----- Codimension-two detection along Hopf branch -----\n');
[hopf_branch_wbifs,hopftestfuncs]=LocateSpecialPoints(funcs,hopf_branch0);
nunst_hopf=GetStability(hopf_branch_wbifs,'exclude_trivial',true);
----- Codimension-two detection along Hopf branch -----
HopfCodimension2: calculate stability if not yet present
HopfCodimension2: calculate L1 coefficients
HopfCodimension2: (provisional) 1 Takens-Bogdanov  detected.
br_insert: detected 1 of 1: BT. Normalform:
    a2: -0.38162
    b2: -1.6895
Singularity of defining system for Hopf bifurcation
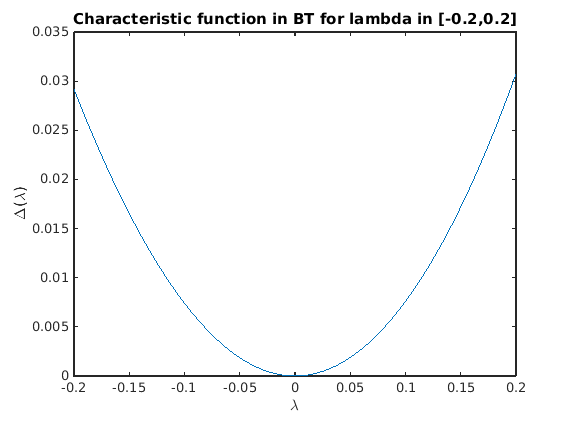
Let us demonstrate that the defining system for the Hopf bifurcation is singular in the Takens-Bogdanov bifurcation. The 8x9 matrix J0 below is its Jacobian (without the pseudo-arclength condition). Its singular-value decomposition shows one zero (up to round-off). hbt is the point along the Hopf branch closest to the BT point.
The characteristic matrix has a double root at lambda=0 in BT.
hbt=hopf_branch_wbifs.point(br_getflags(hopf_branch_wbifs,'BT'));
J0=hopf_jac(funcs,hbt.x,hbt.omega,hbt.v,hbt.parameter,[inddelta,indbeta],hbt.v.');
disp('J0=');
disp(J0);
fprintf('Size of J0: (%d x %d), min(svd(J0))=%g\n',...
    size(J0,1),size(J0,2),min(svd(J0)));
charfunBT=@(lambda)det(ch_matrix(funcs,hbt.x(:,[1,1]),hbt.parameter,lambda));
figure(5);clf;
fplot(charfunBT,[-0.2,0.2]);
title('Characteristic function in BT for lambda in [-0.2,0.2]');
xlabel('\lambda');
ylabel('\Delta(\lambda)');
J0=
  Columns 1 through 6
         0.32        -0.64            0            0            0            0
         0.16        -0.32            0            0            0            0
       1.7889  -2.2204e-16        -0.32         0.64            0            0
  -2.2204e-16   4.4409e-16        -0.16         0.32            0            0
            0            0            0            0        -0.32         0.64
            0            0            0            0        -0.16         0.32
            0            0      0.89443      0.44721            0            0
            0            0            0            0      0.89443      0.44721
  Columns 7 through 9
            0            0            0
            0   7.7716e-18       0.0896
            0            0            0
            0   3.0686e-17     -0.28622
      0.89443            0            0
      0.44721            0            0
            0            0            0
            0            0            0
Size of J0: (8 x 9), min(svd(J0))=1.34042e-16
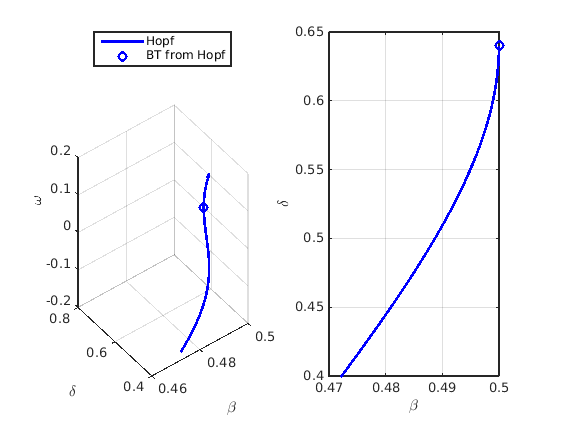
Plot Hopf bifurcation in two-parameter plane, including Takens-Bogdanov point
and in  space.
beta_hopf=getpar(hopf_branch_wbifs,indbeta);
delta_hopf=getpar(hopf_branch_wbifs,inddelta);
omega_hopf=[hopf_branch_wbifs.point.omega];
beta_bt=hbt.parameter(indbeta);
delta_bt=hbt.parameter(inddelta);
omega_bt=hbt.omega;
figure(3);clf;
subplot(1,2,1);
ax3l=gca;
phl=plot3(ax3l,beta_hopf,delta_hopf,omega_hopf,'b-',...
    beta_bt,delta_bt,omega_bt,'bo','linewidth',2);
grid on
b2_lgtext_h={'Hopf','BT from Hopf'};
legend(ax3l,b2_lgtext_h,'location','northoutside');
xlabel(ax3l,'\beta');
ylabel(ax3l,'\delta');
zlabel(ax3l,'\omega');
subplot(1,2,2);
ax3r=gca;
ph=plot(ax3r,beta_hopf,delta_hopf,'b-',...
    beta_bt,delta_bt,'bo','linewidth',2);
grid on
xlabel(ax3r,'\beta');
ylabel(ax3r,'\delta');
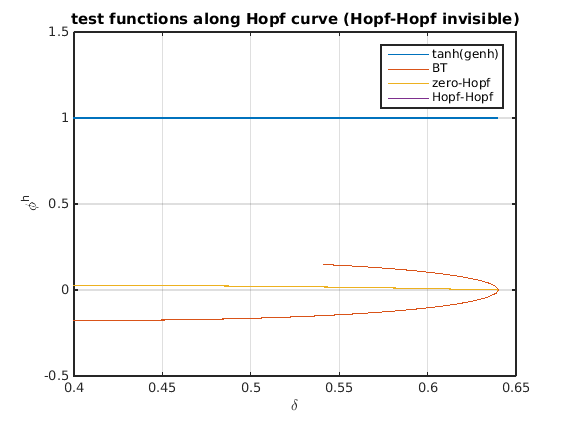
Test functions for codimension-2 bifurcations along Hopf curve
The test functions for 4 codimension-2 bifurcations are in output hopftestfuncs of the utility function HopfCodimension2:
- L1 for generalized hopf (genh),
- sign(omega) for Takens-Bogdanov (bt)
 for zero-Hopf interaction (zeho, touches zero for BT)
 for complex eigenvalue closest to imaginary axis for Hopf-Hopf interaction (hoho).
figure(5);clf
plot(delta_hopf,[tanh(hopftestfuncs.genh(1,:));...
    hopftestfuncs.bt;...
    hopftestfuncs.zeho;...
    hopftestfuncs.hoho]);
grid on
legend({'tanh(genh)','BT','zero-Hopf','Hopf-Hopf'});
set(gca,'ylim',[-0.5,1.5]);
xlabel('\delta');
ylabel('\phi^h');
title('test functions along Hopf curve (Hopf-Hopf invisible)')
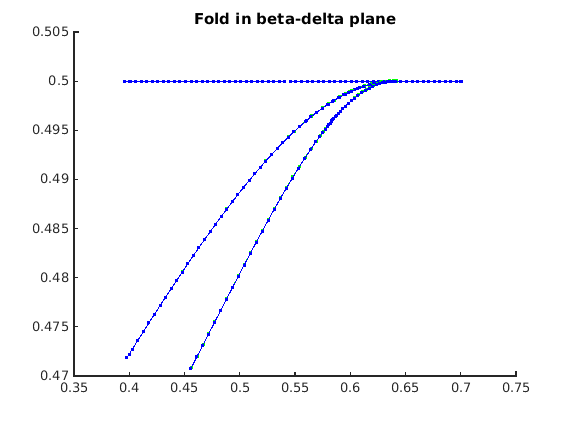
Fold bifurcation
We do a standard continuation, using the starting index obtained from the flagged point indices.
fprintf('----- fold branch -----\n');
[fold_branch0,suc]=SetupFold(funcs,stst_branch_wbifs,br_getflags(stst_branch_wbifs,'fold'),...
    'contpar', [inddelta,indbeta], 'dir', inddelta, 'step', 0.005, parameter_bd{:});
disp(['suc=',num2str(suc)]);
figure(2);
title(ax2,'Fold in beta-delta plane');
fold_branch0=br_contn(funcs,fold_branch0,300);
fold_branch0 = br_rvers(fold_branch0);
fold_branch0=br_contn(funcs,fold_branch0,300);
----- fold branch -----
suc=1
BR_CONTN warning: boundary hit.
BR_CONTN warning: boundary hit.

Detect special points along fold curve
fprintf('----- Codimension-two detection along fold branch -----\n');
[fold_branch_wbifs,foldtestfuncs]=LocateSpecialPoints(funcs,fold_branch0);
nunst_fold=GetStability(fold_branch_wbifs,'exclude_trivial',true);
----- Codimension-two detection along fold branch -----
FoldCodimension2: calculate stability if not yet present
FoldCodimension2: calculate fold normal form coefficients
FoldCodimension2: (provisional) 1 Takens-Bogdanov  detected.
br_insert: detected 1 of 1: BT. Normalform:
    a2: 0.38162
    b2: 1.6895
Insert fold in figure 3
beta_fold=getpar(fold_branch_wbifs,indbeta);
delta_fold=getpar(fold_branch_wbifs,inddelta);
omega_fold=0*beta_fold;
beta_bt2=bgetpar(fold_branch_wbifs,indbeta,'BT');
delta_bt2=bgetpar(fold_branch_wbifs,inddelta,'BT');
hold(ax3l,'on');
pf=plot3(ax3l,beta_fold,delta_fold,omega_fold,'k-',...
    beta_bt2,delta_bt2,0,'ks','linewidth',2);
b2_lgtext_f={'fold','BT from fold'};
legend(ax3l,[b2_lgtext_h,b2_lgtext_f],'location','northoutside');
hold(ax3r,'on');
plot(ax3r,beta_fold,delta_fold,'k-',...
    beta_bt2,delta_bt2,'ks','linewidth',2);

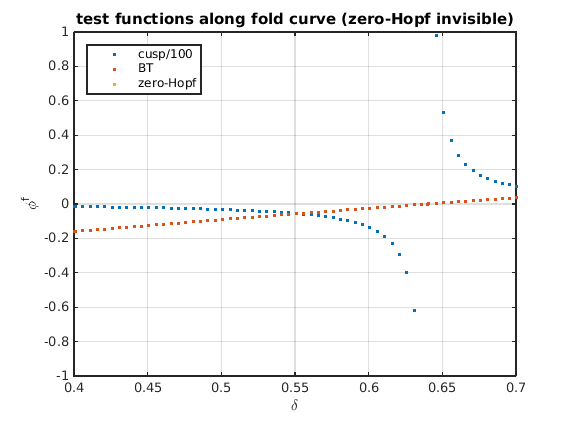
Test functions for codimension-2 bifurcations along fold curve
The test functions for 4 codimension-2 bifurcations are in output foldtestfuncs of the utility function FoldCodimension2:
- a for cusp (genh),
![$[\det(\Delta(\lambda))]'$](HollingTanner_demo_eq12848174940352215749.png) in
in  for Takens-Bogdanov (bt)
- for complex eigenvalue closest to imaginary axis for zero-Hopf interaction (zeho).
figure(5);clf
plot(delta_fold,[real(foldtestfuncs.cusp(1,:))/100;foldtestfuncs.bt;foldtestfuncs.zeho],'.');
grid on
legend({'cusp/100','BT','zero-Hopf'},'location','northwest');
set(gca,'ylim',[-1,1]);
xlabel('\delta');
ylabel('\phi^f');
title('test functions along fold curve (zero-Hopf invisible)')
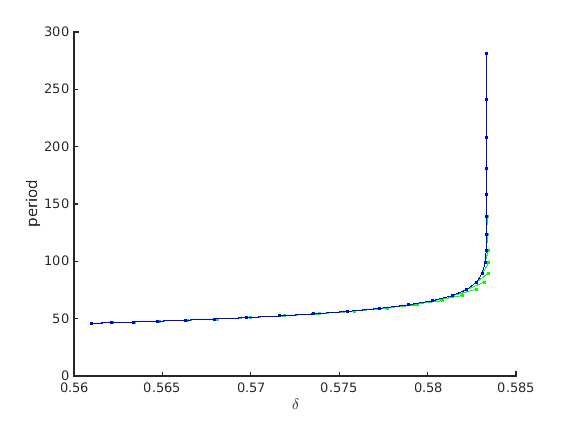
Branch off to periodic orbit at some Hopf point, continue to large period
We know that the orbit must be unstable close to the Hopf bifurcation from the Takens-Bogdanov normal form and the Lyapunov coefficients of the Hopf bifurcation.
psol_branch=SetupPsol(funcs,hopf_branch_wbifs,2,...
    'contpar',inddelta,'degree',3,'intervals',50,parameter_bd{1:4},'max_step',[0,inf]);
[xm,ym]=df_measr(0,psol_branch);
ym.field='period';
ym.col=1;
ym.row=1;
psol_branch.method.continuation.plot_measure.x=xm;
psol_branch.method.continuation.plot_measure.y=ym;
figure(4);clf;
ax4=gca;
psol_branch=br_contn(funcs,psol_branch,25);
xlabel(ax4,'$\delta$','interpreter','latex');
ylabel(ax4,'period');
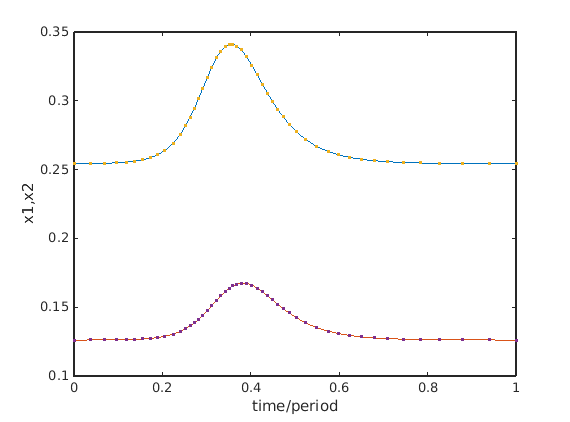
Convert point close to end of the psol_branch to homoclinic orbit
and correct homoclinic orbit.Then refine and repeat correction.
hcli=p_tohcli(funcs,psol_branch.point(end-5));
figure(5);clf;
p_pplot(hcli);
xlabel('time/period');ylabel('x1,x2');
mhcli=df_mthod(funcs,'hcli');
mhcli.point.print_residual_info=1;
[hcli,suc]=p_correc(funcs,hcli,inddelta,[],mhcli.point); % correct
disp(suc);
hcli2=p_remesh(hcli,3,50); % remesh it and
[hcli3,suc]=p_correc(funcs,hcli2,indbeta,[],mhcli.point); % correct it again
disp(suc);
it=1, res=0.000227863
it=2, res=0.00460835
it=3, res=0.000758578
it=4, res=2.03587e-06
it=5, res=9.95759e-13
     1
it=1, res=6.26046e-05
it=2, res=3.05316e-09
     1
Continue branch of homoclinic orbits in two parameters
Branches have to be created manually as described in hom_demo.
hcli_br=df_brnch(funcs,[inddelta, indbeta],'hcli');
hcli_br.point=hcli3;
hcli4=hcli3;
hcli4.parameter(indbeta)=hcli4.parameter(indbeta)-1e-4;
[hcli5,suc]=p_correc(funcs,hcli4,inddelta,[],mhcli.point);
hcli_br.point(2)=hcli5;
hcli_br.parameter.max_bound=fold_branch_wbifs.parameter.max_bound;
hcli_br.parameter.min_bound=fold_branch_wbifs.parameter.min_bound;
hcli_br.parameter.max_step=[indbeta,5e-3;inddelta,5e-3];
hcli_br.method.point.print_residual_info=1;
figure(2);
hcli_br=br_contn(funcs,hcli_br,28);
hcli_br=br_rvers(hcli_br);
hcli_br=br_contn(funcs,hcli_br,40);
it=1, res=0.00140708
it=2, res=0.000118721
it=3, res=4.12108e-06
it=4, res=3.26331e-10
it=1, res=0.000367719
it=2, res=8.65938e-07
it=3, res=1.86163e-10
it=1, res=0.000546802
it=2, res=1.29148e-06
it=3, res=4.0529e-10
it=1, res=6.67961e-05
it=2, res=3.0071e-09
it=1, res=0.000886882
it=2, res=1.94404e-06
it=3, res=8.95831e-10
it=1, res=0.00123595
it=2, res=2.94183e-06
it=3, res=1.98595e-09
it=1, res=0.00188532
it=2, res=4.50991e-06
...
Add homoclinic orbit to two-parameter bifurcation diagram
beta_hcl=getpar(hcli_br,indbeta);
delta_hcl=getpar(hcli_br,inddelta);
phoml=plot3(ax3l,beta_hcl,delta_hcl,0*delta_hcl,'r-','linewidth',2);
phomr=plot(ax3r,beta_hcl,delta_hcl,'r-','linewidth',2);
legend(ax3l,[b2_lgtext_h,b2_lgtext_f,{'homolclinic'}],'location','northoutside');
